Mitch Finnen
December 5, 2022


(Paul Volcker (Chairman, Federal Reserve 1979-1987) on raising interest rates to combat inflation.
Much has been made of the rising interest rate environment in the media year to date. We wanted to take a moment to examine the mechanisms by which central banks tighten conditions in the economy, and the profound impact it can have on asset prices in client portfolios.
As many of you are aware, Central Banks around the world have responded to elevated inflation readings by tightening financial conditions in investment markets. By ‘tightening’ we are mean reducing the availability of credit or liquidity in markets. The two mechanisms that financial market ‘tightening’ can be achieved are raising interest rates, and shrinking Central Bank balance sheets. Shrinking the balance sheet simply means not rolling over/renewing debt that matures.
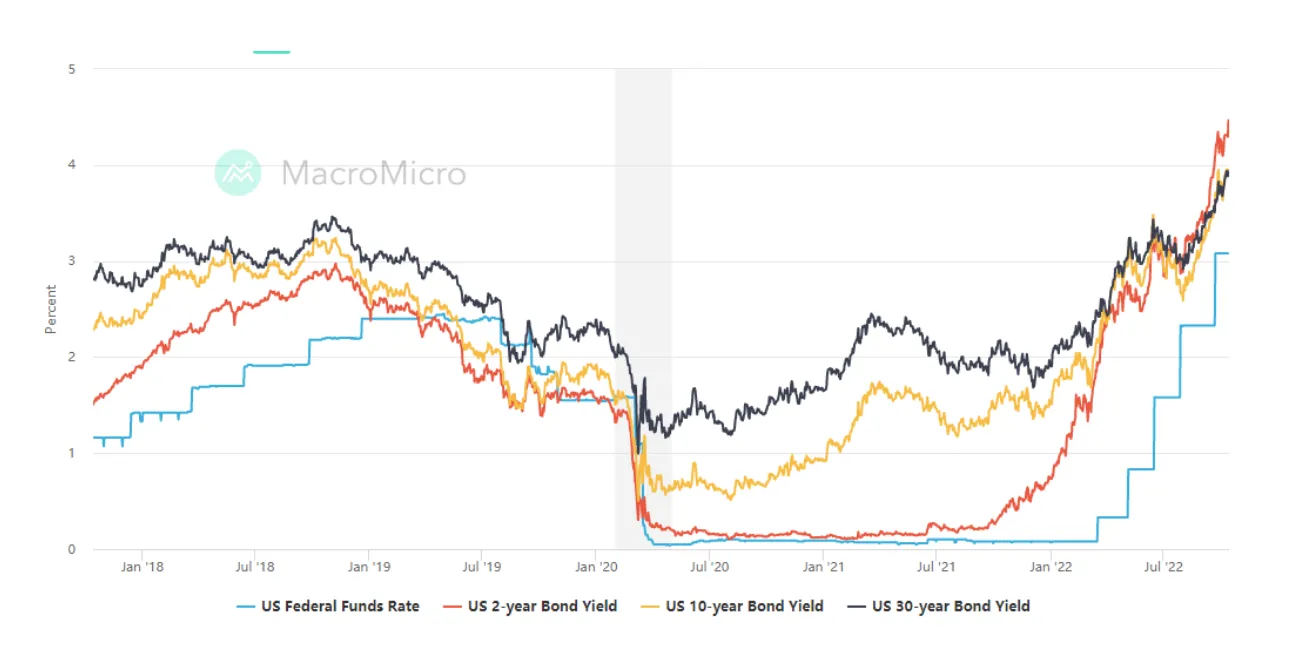
As an example, the Federal Reserve raises interest rates by increasing the amount of interest that banks can charge to each other to lend money overnight. Banks are required to keep funds in an account with the Federal Reserve (or RBA) to cover their obligations to depositors. If a bank has a shortfall, they can borrow overnight from other banks to fund that shortfall. Banks with excess liquidity can lend that excess to another bank at the overnight cash rate. This rate and the market yield on shorter term bonds are closely linked. The relationship is illustrated in the graph below – shorter term rates have a strong correlation with the federal funds (or cash) rate. Also illustrated below is the weakening correlation between the federal funds rate and longer dated interest rates.
To regulate longer term interest rates, the Federal Reserve and other Central Banks engage in quantitative tightening, or quantitative easing (QT and QE respectively). These policies involve the purchase or sale of fixed income instruments in market. Bonds have a fixed face value, for example, $100, so auctions in bids are taken upon a yield basis, i.e., 3.00%, rather than a price basis. If we take federal government bond instruments as an example, a government may wish to issue a bond to finance a new infrastructure project. They will naturally want to do this at the lowest possible interest rate, so they will award bond allocations to the market participants willing to accept the lowest yields. By purchasing a bond at the desired ‘policy’ rate, Central Banks can compress yields and affect longer term borrowing rates in markets. Because the government is our most credit worthy borrower, they borrow at the cheapest rate. All other market participants pay a higher amount, or spread, above the government to compensate lenders for the incrementally higher risk. This is why the ‘cash rate’ can set the baseline in which all other assets or borrowing takes place.
To engage in quantitative tightening, central banks can sell treasury securities into the market, or allow existing assets on their book to mature and retain that cash instead of investing it. By engaging in either of these activities, they decrease the amount of available liquidity in markets.
Understanding the mechanism and the flow on effect this has to markets is a fundamental part of understanding the market narrative of 2022 so far. So how do higher interest rates, which are meant to combat inflation, decrease the value of equities and bonds in the market?
Starting with bonds, the theory is straightforward. As bonds with higher interest rates are issued in the market, investors will pay less for lower yielding bonds. Why would you pay the same amount for a bond yielding 1% and 2%, when the return on a 2% bond will be double the 1% bond? To adjust for the discrepancy in yield, if you want to sell the 1% bond you will need to do so at a discount that brings the total return in line with the market
Equities are a little more complex, and harder to value than bonds. Equities are more difficult to price because there are many more factors influencing their price, with varying degrees of subjectivity. Purchasing an equity represents a claim to a portion of all future profit, and existing assets of a business. One of the most common methods of valuing equities is the discounted cash flow (DCF) model. This model aims to quantify the value of all future cash flows produced by a business and discount the future cash flow to today’s value. By understanding this value, you could theoretically determine whether prices today accurately capture the value of the company. A key input into DCF is the ‘discount rate’. The discount rate is the rate of return you can receive from the market for taking effectively no risk – i.e. buying a short dated government treasury from a developed nation. When this interest rate changes, future cash flows are discounted more heavily thus decreasing the equity value. It is worth noting – this discount says nothing about the quality or outlook of the company. It is a purely mathematical discount applied indiscriminately. For companies carrying debt, rising interest rates increase the cost of servicing that debt. So, all else being equal, their return on invested capital is lower because the cost of that capital is higher. Similarly, with a higher cost of capital, or debt, consumers decrease their spending; thus, the impact of interest rate increases on equity values is twofold.
Another way to consider this, is that the cash rate is the ‘risk free’ rate of return. If a government bond moves from 1.00% to 5.00%, an investor in equities will want to see a higher return for the uncertainty and the additional risk they are taking. An investor may have been happy with a 4% dividend from shares they own, when cash rates were 1.00%, but now they demand 8.00%. The price for all assets needs to adjust to reflect the higher yield investors demand for risk-taking.
The Outlook
Because if the above impact, it becomes important to understand the current path of interest rates, and how this may affect asset markets over the course of the economic cycle.
As it stands today, the balance of market pricing is below:
Treasury
Current Rate
Expected Peak
Reserve Bank of Australia
2.60%
4.00%
European Central Bank
1.25%
2.00% -2.75%
U.S. Federal Reserve
3.25%
4.40% – 4.65%
Forecasting interest rates is uniquely hard, and frustrating. Many revisions have occurred within market pricing of future interest rates over the last 9 months. Shown below are the market expectations from mid-August in light blue, to mid-October in dark blue. Market expectations continue to evolve, so far largely upwards as inflation has been more stubborn than expected. The wide spread you can see in the dark blue shaded area reflects the uncertainty of rate expectations.
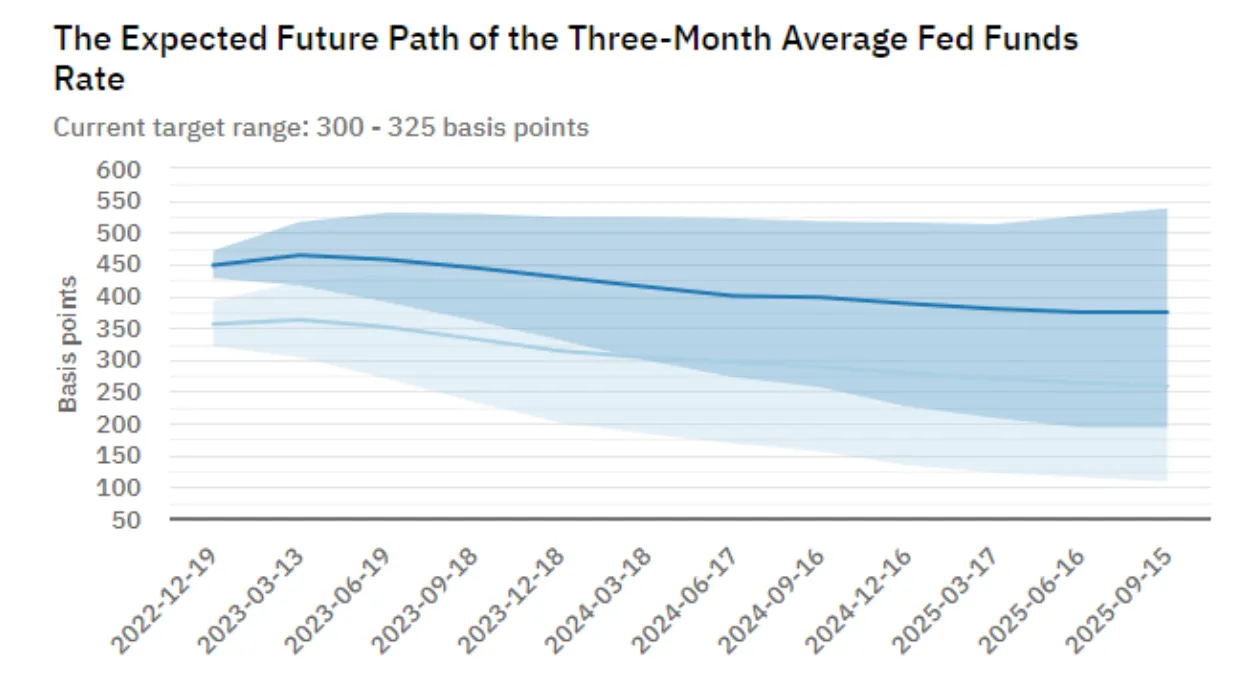
Stances from the RBA, ECB and US Federal Reserve are that interest rates will continue to increase, until inflation is brought under control. Central banks have avoided publishing a specific terminal rate to market. A terminal rate, or ‘neutral rate’ as you may have heard about in the paper, refers to the rate where inflation equals or is offset by the cost of capital. A rate that is neither accommodative, nor restrictive. Instead, it is ‘neutral.’ This is largely because it is unknown across all markets as to what the neutral rate will need to be to control inflation. We won’t know what it is until we get there. If you rely on market pricing as an indicator, you are likely to be wrong. In the following graph, each blue line indicates how the markets priced the future RBA cash rate on specific days. The red line is the observed cash rate over the period.

To summarise, the terminal/neutral cash rate is important because it guides the risk-free rate of return, and in turn, the discount rate applied to future cash flows. We don’t know where the terminal rate will be. If economies begin to weaken and show signs of stress, terminal rate expectation may lower. If economies retain low levels of unemployment and high inflation, expectations will continue to move higher.
The 60/40 portfolio
For many years, a stalwart of portfolio theory is the ‘60/40’ portfolio, which comprises of 60% major equity indices and 40% major bond indices. By balancing an exposure between equities and bonds, you capture the equity upside and receive the protection of bonds in market conditions that are not favourable to equities. As an example, the Barclays Global Aggregate Index returned 6.85% in the calendar year from 31-Dec 2007 to 31-Dec 2008, where the S&P 500 fell around 40%.
In 2022, a 60/40 portfolio would have provided no protection at all.
Where the S&P 500 has fallen approximately 25%, the Barclays Bond Index has also fallen 12.79%. The difference in 2022 is rising interest rates. As discussed in ‘The Mechanics’ section above, a rising interest rate, all else being constant, will devalue both equities and bonds. Interest rates rising from a zero lower bound has done unmitigated damage to 60/40 portfolios and has illustrated the value of asset that produce returns that are either uncorrelated with rising interest rates, or positively correlated with rising rates.
Having thoroughly explored the risks and challenges of rising rates above, there are also opportunities that must be considered.
The Opportunity
As rates improve from a zero bound, fixed income becomes much more attractive. Bonds become higher yielding, and lower yielding bonds can be purchased at a discount as investors attempt to exit their positions. As we approach the terminal rate, above-trend inflation is controlled and price stability returns to the global economy, we would expect that interest rates will decline, providing capital upside for those who purchased fixed rate bonds that have a higher relative yield today, compared to those issued in the future.
Floating rate instruments are also attractive in an inflationary environment, given the increasing yield. Government and corporate, Bank notes, private credit, and high-yield debt can all offer floating rate securities, which is an inflation hedge for portfolios. For the first time in several years, these instruments provide meaningful yield and an attractive risk adjusted return.
We also believe that the asset types and classes which have suffered the most through multiple compression (revaluations based on higher rates) are going to become attractive investments for selective buyers. At the time of writing, the areas that have been most heavily compressed include private equity, technology stocks, and global real estate. Growth stocks, or simply, businesses that invest into future growth at the expense of paying out dividends today, have been most heavily impacted. This is because, higher costs of capital can change investor priorities. However, over the long-term, companies that pay out high levels of income instead of reinvesting in R&D, innovation or future growth typically see their share prices stall. This has been evident in mining and resources exposure, which despite performing well year to date, see their share prices trading at levels close to the previous decade. A similar story can be told about most of our big banks. If you do the same exercise for technology related businesses over the decade, even despite large bouts of volatility and the declines seen year to date, total returns are multiples higher.
When purchasing in markets that have had significant drawdowns, it is important to ensure the quality of assets is centred. It will do you no good to buy poor assets that have re-rated due to quality – the aim must be to identify through quality portfolio management the businesses and assets that have been subject to macroeconomic forces but remain best in class. Ignoring the share price, but instead focusing on ley operating metrics of each business – their number of customers, sales, their profitability, balance sheet, return on equity all tell a bigger story.
Best regards,
Mitch & Charles
Emanuel Whybourne & Loehr Pty Ltd (ACN 643 542 590) is a Corporate Authorised Representative of EWL PRIVATE WEALTH PTY LTD (ABN: 92 657 938 102/AFS Licence 540185).Unless expressly stated otherwise, any advice included in this email is general advice only and has been prepared without considering your investment objectives or financial situation.
There has been an increase in the number and sophistication of criminal cyber fraud attempts. Please telephone your contact person at our office (on a separately verified number) if you are concerned about the authenticity of any communication you receive from us. It is especially important that you do so to verify details recorded in any electronic communication (text or email) from us requesting that you pay, transfer or deposit money, including changes to bank account details. We will never contact you by electronic communication alone to tell you of a change to your payment details.
This email transmission including any attachments is only intended for the addressees and may contain confidential information. We do not represent or warrant that the integrity of this email transmission has been maintained. If you have received this email transmission in error, please immediately advise the sender by return email and then delete the email transmission and any copies of it from your system. Our privacy policy sets out how we handle personal information and can be obtained from our website.
The information in this podcast series is for general financial educational purposes only, should not be considered financial advice and is only intended for wholesale clients. That means the information does not consider your objectives, financial situation or needs. You should consider if the information is appropriate for you and your needs. You should always consult your trusted licensed professional adviser before making any investment decision.
Emanuel Whybourne & Loehr Pty Ltd (ACN 643 542 590) is a Corporate Authorised Representative of EWL PRIVATE WEALTH PTY LTD (ABN: 92 657 938 102/AFS Licence 540185).Unless expressly stated otherwise, any advice included in this email is general advice only and has been prepared without considering your investment objectives or financial situation.
There has been an increase in the number and sophistication of criminal cyber fraud attempts. Please telephone your contact person at our office (on a separately verified number) if you are concerned about the authenticity of any communication you receive from us. It is especially important that you do so to verify details recorded in any electronic communication (text or email) from us requesting that you pay, transfer or deposit money, including changes to bank account details. We will never contact you by electronic communication alone to tell you of a change to your payment details.
This email transmission including any attachments is only intended for the addressees and may contain confidential information. We do not represent or warrant that the integrity of this email transmission has been maintained. If you have received this email transmission in error, please immediately advise the sender by return email and then delete the email transmission and any copies of it from your system. Our privacy policy sets out how we handle personal information and can be obtained from our website.


.webp)

NewsLetter

Free Download
