Tim Whybourne
June 26, 2024


“The best time to plant a tree was twenty years ago, the second-best time is now”.
– Old Chinese Proverb.
Recently we finally taught our seven-year-old son to ride his bike without training wheels. I could tell exactly the moment he made up his mind that he was going to do it. It was one evening after work, we were on the street when one of his little mates from a few houses down was showing off his bike skills by peddling as fast as he could and then slamming on the back pedal to skid out the back tyre, leaving my son in his dust as he peddled behind on his trainer wheels. I must admit, even I was a little impressed, it was a very cool skid.
As children, everything is new and so all experiences are richly encoded in the brain. With so much information and data being processed, children have the sense that time passes very slowly. I vividly remember, as a kid, that from Christmas to Christmas and birthday to birthday seemed like it took forever, a week felt like a month and a year felt like a century, not so much anymore, we are running out of new experiences!
As adults, we are not so lucky, I think we all feel that the earth spins faster every year, we blink and our kids have grown another foot, it is hard for me to believe that we are soon to clock over the end of financial year.. again!
It's not only kids that are nervous about new experiences, but adults are also naturally worried about anything new too. This is in our DNA and investing in unchartered territory as a market reaches new high certainly counts as a new experience. But just as kids conquer their fears and break down barriers, so should we as investors which I will explain in the following.
The S&P500 last hit an all-time high on June 17, 2024, and the ASX200 last hit its all-time high on the 16th of May 2024 but this is no reason for alarm (as at the time of writing on 26/6/24).
Since 1950, the broad US equity market has set 1250 all-time highs along its path to current levels, if you do the math on that its roughly 16 all-time highs each year on average. This should be no surprise because naturally, if inflation is going up, then companies' earnings should be going up with everything else and in turn share prices should be going up on a nominal basis.
This can only lead to a higher market over the long term, so I would argue that without anything particularly interesting happening, providing that economies continue to grow (which they should if population growth persists) then markets will be pushed to continue to break all-time highs, time and time again. This will, however, not be in a straight line.
The chart below shows the number of all-time highs set in the S&P500 each decade from the 50s through to the 2020s. You will note that each decade has several all-time highs implying that ‘time in the market’ is a valid strategy. All-time highs are nothing to be afraid of.

A great illustration of this is if you look at the 2009/2009 period or the GFC… The GFC looks like a little blip on this zoomed out chart below.
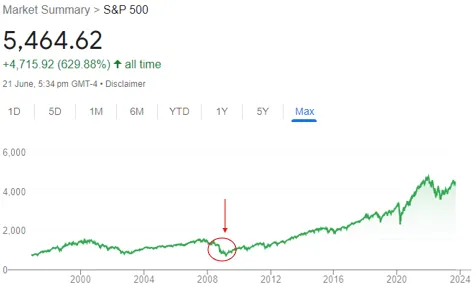
But if you zoom in to the following chart it looks terrifying.

Living through that period, it was a comfortable trade to buy at the top of the market Pre GFC, most people were euphoric, and it was the typical “taxi-driver market” where everyone was giving you stock tips from friends at BBQs to your tax driver. This is not the same feeling today.
I also remember it was not a comfortable trade to buy the market on the way back up in 2009, the market was climbing “a wall of worry”. We can draw parallels to the current period as this rally also feels like a “wall of worry”.
When markets surpassed their all-time highs in 2013, people were saying very similar things to what they are saying now that, they may have missed the boat and now markets are back at all-time highs they will wait for the next crash. But market crashes (not to be confused with a smaller pullback) are a once in a cycle event and you could be waiting a decade before this eventuates (If history is anything to go by).
Had you not bitten the bullet and jumped back into the market at all-time highs in 2013 you would have missed out on the market continuing to rally for another nearly 10 years in one of the greatest bull runs the world had ever seen (yet)!
The pie charts below show how frequently a market correction follows an all-time high. You can see below that 1 year out, markets are either no greater than 10% lower or actually higher 91% of the time, 3 years out this becomes 98% of the time and 5 years out it becomes 100% of the time, so from this one can assume downside is relatively limited if you take a long term view.

Source: https://www.rbcgam.com/en/ca/learn-plan/investment-basics/investing-at-all-time-highs/detail
Another interesting chart below (thanks to Clearbridge) suggests that putting money to work at all-time highs has historically outperformed deploying capital when the benchmark is below peak on average (I bet you didn’t see that one coming).

A report written by Fidelity also showed the impact that having $100 invested in the US stock market in January 1926 and found that it would be worth $85,008 at the end of 2023 (a 7.1% compound growth rate). The contrast study was a strategy which sold to cash when the market reached an all-time high and went back in again on a pullback would only be worth $8,790 or a 4.7% compound return. This illustrates two points, the first being it pays to stay invested and second the power of compound return showing that a 2.4% improvement in return over 98 years on $100 resulted in a nearly 80k difference in return.
In a previous addition we studied another version of this in a blog titled “don’t be your own worst enemy” which can be found here: https://www.ewlwealth.com.au/post/dont-be-your-own-worst-enemy. This followed a fictional character that kept investing at the worst time possible, before every market crash from 1950 through to July 2012. He found that even though this investor had the worst possible timing ever, he still achieved a 9% compound return and the key to that was staying invested and not selling over a long period of time.
It is all well and good to talk about what markets have done historically but every market has its own nuances and differences to the last, so it is also important to consider current economic circumstances. We will go into this in much more detail in our upcoming semi-annual report however we do believe there are several reasons to be optimistic on the direction of markets in the coming years, primarily driven by fundamental economic growth and easier monetary conditions.
The interesting thing about this rally is that although we are seeing markets reach all-time highs, it's not really telling the full story. The current rally has really just been driven by the top 10 stocks as you can see below.

From January 2023 to March 2024 the S&P500 rallied 22% v the top 7 stocks which rallied an eye watering 99%.

This means one of two things, the first and most likely scenario being that the rest of the market will start to catch up at some stage and the second being that the top 10 stocks will meet the rest of the market lower, we believe this is less likely given the recent strength of their earnings coming in at an average of over 50% EPS growth, and closer to 70% eps growth for the top 5 stocks.
For those of you interested in what Wall Street is thinking on fundamental values please see the below chart of year end wall street targets. The key thing to note here is that nearly all Wall Street analysts have increased their year-end targets considerably from the beginning of the year with the average price target currently sitting around where the market is today, the most bullish is a 500 point rise (circa 10%) to 6000 and the most bearish being JPM at 4200 (which would represent a circa 25% fall).

Source: CNBC Pro
Regardless of which one of these forecasts is closer, even if JPM Is right and the market corrects 25%, we know that markets do not go up in straight lines, there will undoubtably be some turbulence along the way. This does feel to me very much like the early 2010’s after recovering from the GFC where markets returned nearly 3x from the bottom of the market in 2009 through to 2020.
As many of you will know, I am a huge believer in disruptive technology and believe that what we are witnessing in Genomics, Artificial Intelligence, Space and Digital Finance could be the biggest and fastest changes the world has ever seen in wealth creation driven by increasing efficiencies.
As investors, you always need to take a long term view and that doesn’t always feel comfortable but looking back over my career, even if I had the chance to go back in time and invest only at every single market high I could (even the ones that immediately preceded a market crash), I would take that in a second and it would have paid off in spades!
Emanuel Whybourne & Loehr Pty Ltd (ACN 643 542 590) is a Corporate Authorised Representative of EWL PRIVATE WEALTH PTY LTD (ABN: 92 657 938 102/AFS Licence 540185).Unless expressly stated otherwise, any advice included in this email is general advice only and has been prepared without considering your investment objectives or financial situation.
There has been an increase in the number and sophistication of criminal cyber fraud attempts. Please telephone your contact person at our office (on a separately verified number) if you are concerned about the authenticity of any communication you receive from us. It is especially important that you do so to verify details recorded in any electronic communication (text or email) from us requesting that you pay, transfer or deposit money, including changes to bank account details. We will never contact you by electronic communication alone to tell you of a change to your payment details.
This email transmission including any attachments is only intended for the addressees and may contain confidential information. We do not represent or warrant that the integrity of this email transmission has been maintained. If you have received this email transmission in error, please immediately advise the sender by return email and then delete the email transmission and any copies of it from your system. Our privacy policy sets out how we handle personal information and can be obtained from our website.
The information in this podcast series is for general financial educational purposes only, should not be considered financial advice and is only intended for wholesale clients. That means the information does not consider your objectives, financial situation or needs. You should consider if the information is appropriate for you and your needs. You should always consult your trusted licensed professional adviser before making any investment decision.
Emanuel Whybourne & Loehr Pty Ltd (ACN 643 542 590) is a Corporate Authorised Representative of EWL PRIVATE WEALTH PTY LTD (ABN: 92 657 938 102/AFS Licence 540185).Unless expressly stated otherwise, any advice included in this email is general advice only and has been prepared without considering your investment objectives or financial situation.
There has been an increase in the number and sophistication of criminal cyber fraud attempts. Please telephone your contact person at our office (on a separately verified number) if you are concerned about the authenticity of any communication you receive from us. It is especially important that you do so to verify details recorded in any electronic communication (text or email) from us requesting that you pay, transfer or deposit money, including changes to bank account details. We will never contact you by electronic communication alone to tell you of a change to your payment details.
This email transmission including any attachments is only intended for the addressees and may contain confidential information. We do not represent or warrant that the integrity of this email transmission has been maintained. If you have received this email transmission in error, please immediately advise the sender by return email and then delete the email transmission and any copies of it from your system. Our privacy policy sets out how we handle personal information and can be obtained from our website.


NewsLetter

Free Download
